Exercise: 3D Change Analysis at an Active Rock Glacier using Multitemporal Point Clouds
Solution using CloudCompare
Change analysis via DEM differencing
Tip: In the video we use pdal but in the new version of QGIS you can also rasterize point clouds directly.
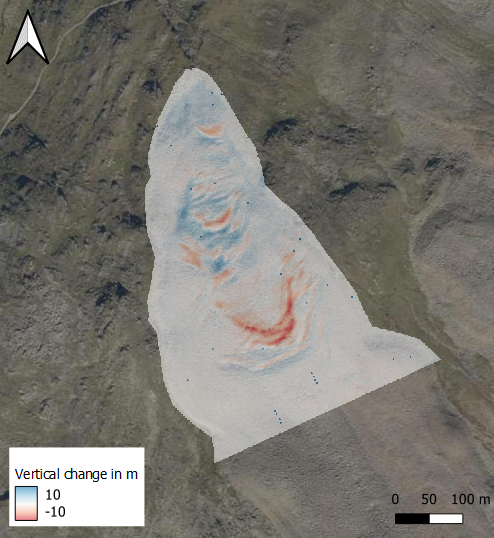
At the end you can visualize the DEM in OGIS, which should look something like this:

Change analysis via DEM differencing: Vertical change between 2020 and 2021. The basemap is provided by the Web Map Service of Tyrol (https://gis.tirol.gv.at/arcgis/services/Service_Public/orthofoto/MapServer/WMSServer).