E-TRAINEE: Discrimination of selected grass species from time series of RPAS hyperspectral imagery - report
Example results
Random forest classification in R
| Image | Classification |
|---|---|
| June | 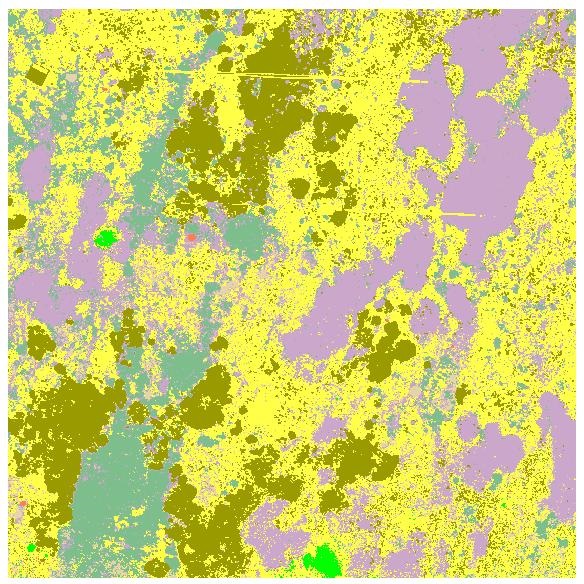 |
| August | 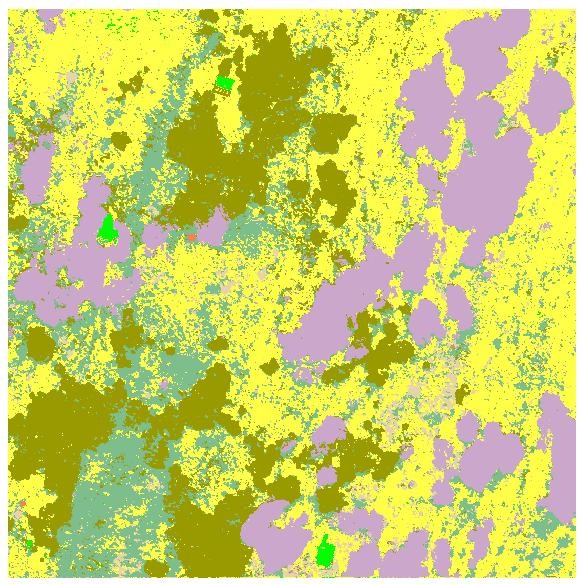 |
| June + August | 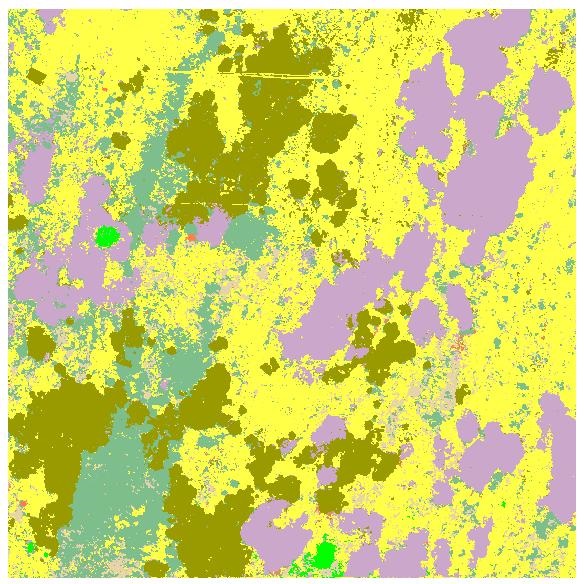 |
| August MNF | 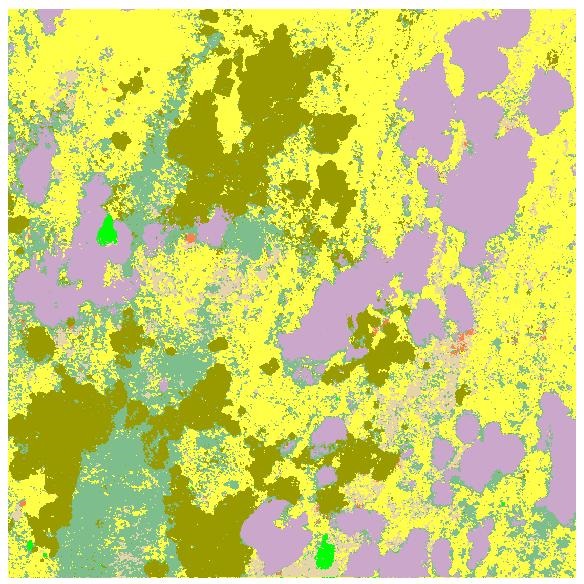 |
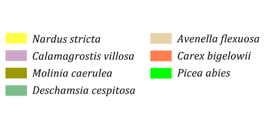
Classification legend
Accuracy assessment
| June | OA=85.91% | August | OA=88.03% | ||||
|---|---|---|---|---|---|---|---|
| Class | Recall | Precision | F1-score | Recall | Precision | F1-score | |
| afs | 29.13 | 48.05 | 36.27 | 29.13 | 56.92 | 38.54 | |
| cv | 96.89 | 86.16 | 91.21 | 99.42 | 99.13 | 99.27 | |
| cxbig | 0.00 | 0.00 | 0.00 | 0.00 | 0.00 | 0.00 | |
| desch | 87.30 | 87.30 | 87.30 | 80.95 | 74.45 | 77.56 | |
| mol | 88.12 | 95.10 | 91.48 | 96.62 | 94.07 | 95.33 | |
| nard | 79.28 | 71.56 | 75.22 | 85.62 | 75.70 | 80.35 | |
| smrk | 90.00 | 97.83 | 93.75 | 26.00 | 92.86 | 40.63 |
| June + August | OA=92.60% | August MNF | OA=91.89% | ||||
|---|---|---|---|---|---|---|---|
| Class | Recall | Precision | F1-score | Recall | Precision | F1-score | |
| afs | 41.73 | 47.75 | 44.54 | 51.18 | 54.62 | 52.84 | |
| cv | 99.22 | 98.08 | 98.65 | 99.42 | 99.22 | 99.32 | |
| cxbig | 10.00 | 62.50 | 17.24 | 18.00 | 81.82 | 29.51 | |
| desch | 90.00 | 86.04 | 87.98 | 90.63 | 84.72 | 87.58 | |
| mol | 97.58 | 99.02 | 98.29 | 98.07 | 97.60 | 97.83 | |
| nard | 93.23 | 86.81 | 89.91 | 84.57 | 82.82 | 83.69 | |
| smrk | 92.00 | 97.87 | 94.84 | 72.00 | 100.00 | 83.72 |
Q&A
- Is it possible to classify individual grass species from a mono-temporal UAS dataset with very high spatial resolution (9 cm) and spectral resolution (54 bands) with an overall accuracy higher than 85%?
- yes, both of the mono-temporal datasets (June and August) achieved an OA above 85%
- however, the precision and recall varied for different species
- What is the classification accuracy of the dominant and sparse growth species?
- dominant grass species (cv, mol, nard, desch) reach excellent accuracy; sparse species not so much
- abundance/density/homogeneity of the species and its cover are essential for classification accuracy
- Can we reach higher accuracy using time series of intra-seasonal data? How significant are the differences?
- accuracy increased with spatial resolution; multitemporal composite from June and August 2020 reached the highest OA of 92.6%
- Optional: Can image data transformation that reduces noise and data dimensionality (MNF transformation) produce better results than the original hyperspectral dataset?
- yes, the MNF transformed image OA is 91.89%, which corresponds to a 3.96 % increase when compared to the classification of the original August dataset
Back to case study
Proceed by returning to Discrimination of selected grass species from time series of RPAS hyperspectral imagery